The D&L Blog


By Brian Greene, Director of Trails and Conservation and Data Scientist
When going out on the D&L Trail recently you might have had a common thought: “Wow, there are a lot of people out on the trail today.” Maybe you caught it at a popular time. Perhaps you were out on that first warm day when everyone feels that primal call of spring to get outdoors. As the data scientist for the D&L, I often try to take these qualitative insights and measure them in quantitative ways.
One of my main projects is counting trail users. This turns out to be much more difficult than you would imagine. For one, the D&L Trail is an exceptionally long trail with 146 miles currently open for use and lots of places people can get on and off. Plus, people tend to use the trail at all hours of the day and have many different modes of transportation (walking, running, cycling, etc.). So, we know that we cannot count every single person who visits the trail. As a result, we designed a system to representatively monitor the entire trail so that we can estimate use. We use machines called trail counters which place invisible beams across the trail. When a person walks or bikes past this beam, a trail count is recorded.
Recently, with COVID-19 shutting down much of the economy, one of the few options people had for activities outside their home was recreating outdoors on a trail or at a park. Our trail counters monitor this so we can track the results. So, that feeling you had that there were a lot of people out on the trails? The data backs it up and demonstrates it in two ways.
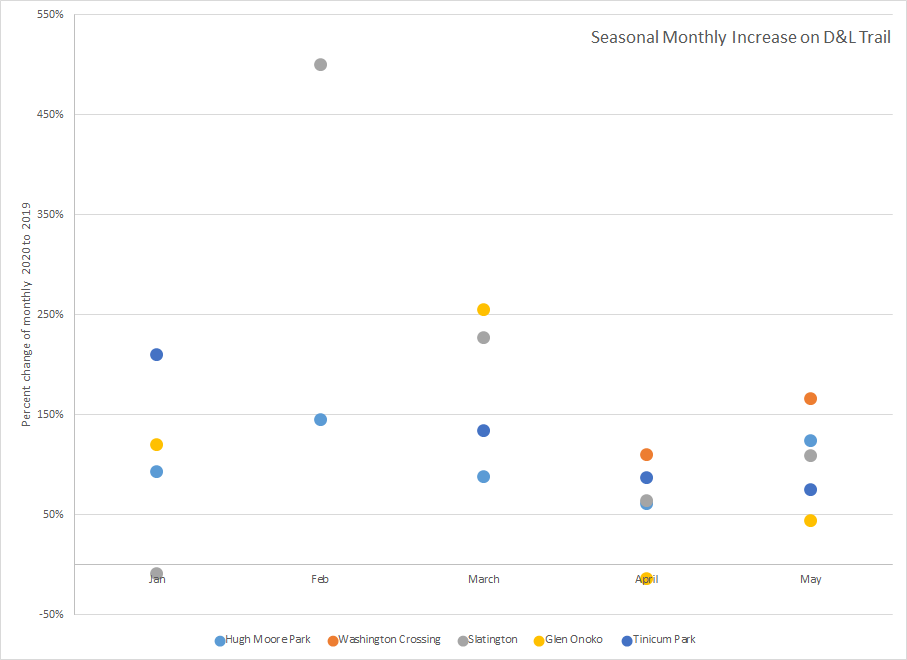
Seasonal Increases
First, when we compare the trail counts of cyclists from a month in 2020 to the same month in 2019, we see large seasonal increases. Overall, from five different trail counters we saw monthly increases of 144% (March), 63% (April), and 105% (May). But when you look at the sites individually, you will see some sites as high as 255%. Interestingly, trail counts were already higher in January and February due to climate change, resulting in a warmer winter that had virtually no snow.
| Year | Jan | Feb | March | April | May |
| 2019 | 1119 | 608 | 3395 | 13243 | 21421 |
| 2020 | 1996 | 2090 | 8272 | 21555 | 43889 |
| Percent Change | 78.4% | 243.8% | 143.7% | 62.8% | 104.9% |
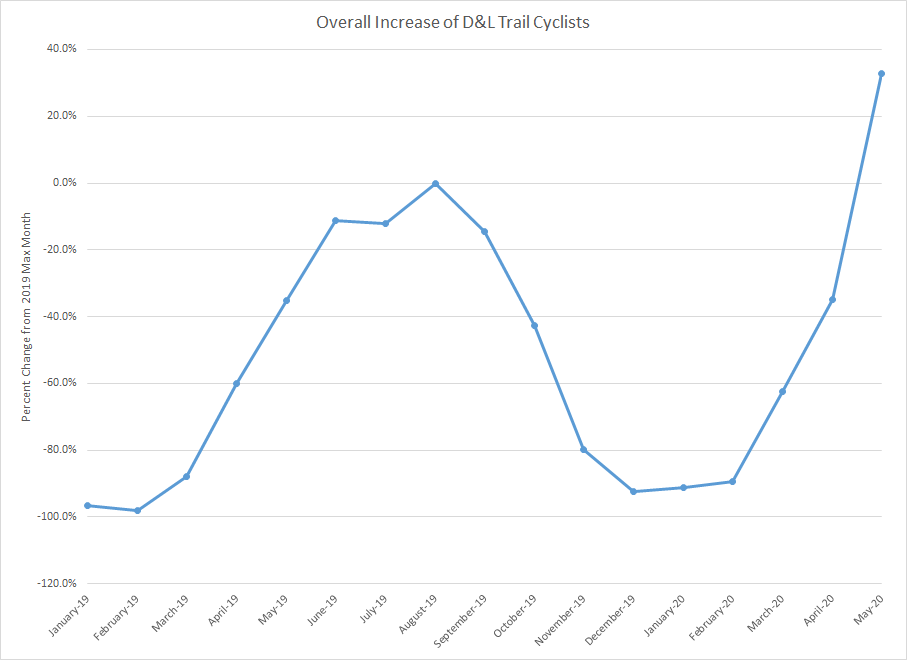
Overall volume increases
Second, while the previous data shows a seasonal trend, I was interested in looking at an overall volume trend. To do this, I analyzed the highest month count in 2019 (August) and compared what the percent change was for that count. For comparison, while March and April 2020 saw a large seasonal increase, their total counts were still lower than the max in 2019. However, in May, the D&L Trail recorded its highest count for cyclists ever. This was likely the result of warmer weather and continued restrictions on activities outside of the home. May 2020 saw a 32.7% increase on the 2019 maximum count. This data point along with other information—like national bike sales increasing—leads me to believe that we are seeing new trail users as a result of the COVID–19 pandemic.
What does this mean? To me, this is hard data that shows that trails are a critical part of communities. Moreover, it reveals that in turbulent times trails provide an essential place for people to recreate, de-stress, and stay healthy.
We need trails more than ever, and more people are using the D&L Trail more than ever before. That’s why it’s important that we practice proper trail etiquette and support trails. You can support the D&L Trail in many ways including volunteering, telling public officials how much you value trails, and making a donation to the D&L. Every bit helps, and I hope all our new trail users do their part to ensure a vibrant and resilient D&L Trail for everyone to enjoy.
Archives
- Mar 2026
- Feb 2026
- Jan 2026
- Dec 2025
- Nov 2025
- Oct 2025
- Sep 2025
- Aug 2025
- Jul 2025
- Jun 2025
- May 2025
- Apr 2025
- Mar 2025
- Feb 2025
- Dec 2024
- Nov 2024
- Oct 2024
- Sep 2024
- Aug 2024
- Jul 2024
- Jun 2024
- May 2024
- Apr 2024
- Mar 2024
- Feb 2024
- Jan 2024
- Dec 2023
- Nov 2023
- Oct 2023
- Sep 2023
- Aug 2023
- Jul 2023
- Jun 2023
- May 2023
- Apr 2023
- Mar 2023
- Feb 2023
- Jan 2023
- Dec 2022
- Nov 2022
- Oct 2022
- Sep 2022
- Aug 2022
- Jul 2022
- Jun 2022
- May 2022
- Apr 2022
- Mar 2022
- Feb 2022
- Jan 2022
- Dec 2021
- Nov 2021
- Oct 2021
- Sep 2021
- Aug 2021
- Jul 2021
- Jun 2021
- May 2021
- Apr 2021
- Mar 2021
- Feb 2021
- Jan 2021
- Dec 2020
- Nov 2020
- Oct 2020
- Sep 2020
- Aug 2020
- Jul 2020
- Jun 2020
- May 2020
- Apr 2020
- Mar 2020
- Feb 2020
- Jan 2020
- Dec 2019
- Nov 2019
- Oct 2019
- Sep 2019
- Aug 2019
- Jun 2019
- May 2019
- Apr 2019
- Mar 2019
- Feb 2019
- Jan 2019
- Dec 2018
- Nov 2018
- Oct 2018
- Sep 2018
- Aug 2018
- Jul 2018
- Jun 2018
- May 2018
- Apr 2018
- Mar 2018
- Feb 2018
- Dec 2017
- Nov 2017
- Oct 2017
- Sep 2017
- Aug 2017
- Jul 2017
- Jun 2017
- May 2017
- Apr 2017
- Mar 2017
- Feb 2017
- Jan 2017
- Nov 2016
- Oct 2016
- Sep 2016
- Aug 2016
- Jul 2016
- Jun 2016
- May 2016
- Apr 2016
- Mar 2016
- Feb 2016
- Jan 2016
- Nov 2015
- Oct 2015
- Sep 2015
- Aug 2015
- Sep 2014
- Aug 2014
- Jul 2014
- Jun 2014
- May 2013
- Apr 2013
- Jan 2013
- Oct 2012
- Sep 2012
- Aug 2012
- Jul 2012
- Jun 2012
- May 2012
- Apr 2012
- Mar 2012
- Feb 2012
- Dec 2011
- Nov 2011
- Oct 2011
- Sep 2011
- Aug 2011
- Jul 2011
- Jun 2011
- May 2011
- Apr 2011
- Mar 2011
- Feb 2011
- Jan 2011
- Dec 2010
- Nov 2010
- Oct 2010
- Sep 2010
- Aug 2010
- Jul 2010
- Jun 2010
- May 2010
- Apr 2010
- Mar 2010
- Feb 2010
- Jan 2010
- Dec 2009
- Nov 2009
- Oct 2009
- Sep 2009
- Aug 2009
- Jul 2009
- Jun 2009
- May 2009
- Apr 2009
- Mar 2009
- Feb 2009
- Jan 2009
- Dec 2008
- Nov 2008
- Oct 2008
- Sep 2008
- Aug 2008
- Jul 2008
- Jun 2008
- May 2008
- Apr 2008